Topic 5 Tutorial Questions
- 2022年3月22日
- 讀畢需時 6 分鐘
已更新:2024年1月22日
Question 3
The US Department of Transportation requires tire manufacturers to provide tire performance information on the sidewall of the tire to better inform prospective customers when making purchasing decisions. One very important measure of tire performance is the tread wear index, which indicates the tire's resistance to tread wear compared with a tire graded with a base of 100. This means that a tire with a grade of 200 should last twice as long, on average, as a tire graded with a base of 100. A consumer organization wants to estimate the actual tread wear index of a brand name of tires that claims "graded 200" on the sidewall of the tire. A random sample of n=18 indicates a sample mean tread wear index of 195.3 and a sample standard deviation of 21.4.
Assuming that the population of tread wear indexes is normally distributed, construct a 95% confidence interval estimate of the population mean tread wear index for tires produced by this manufacturer under this brand name.
Do you think that the consumer organization should accuse the manufacturer of producing tires that do not meet the performance information provided on the sidewall of the tire? Explain.
Explain why an observed tread wear index of 210 for a particular tire is not unusual, even though it is outside the confidence interval developed in (a).
Approach:
Question 3 in the topic 5 tutorial exercise is a great question that challenges your understanding of both sampling distribution and confidence interval. So before I step into this question, I want to review you with some important concepts.
Sampling Distribution
First of all, a sampling distribution is the distribution of sample statistics (a measure that describes the sample), which in this case is the sample mean. Each individual data point in the sampling distribution is a sample mean by itself. We can determine the shape (normal or not), mean and standard deviation of the sampling distribution from the population.
The rules can be summarized as follow:
If the population distribution is normal, then the sampling distribution of the sample mean would also be normal.
If the sample size >= 30, then the sampling distribution of the sample mean would be normal.
The mean of the sampling distribution would be equal to the population mean

The standard deviation of the sampling distribution would be equal to the population standard deviation divided by the square root of n

For more details on sampling distribution, go here: Statistics 9: Sampling Distribution Clearly Explained!
Now let's apply these rules to the context of the question. Let's derive the sampling distribution of the sample mean tread wear index.
The question assumes the population of tread wear indexes is normally distributed, which means the sampling distribution of the sample mean tread wear index would also be normal.
Since the question doesn't give us any information about the population mean μ and population standard deviation σ, we estimate them using the given sample mean of 195.3 and sample standard deviation of 21.4. Now, we can find the mean and standard deviation of the sampling distribution.

Perfect, we can now visualize the sampling distribution with the following notation and illustration.


Confidence Interval Estimation
The purpose of the confidence interval is used to estimate a population parameter. In this case, we want to estimate the population mean tread wear index. Here, we have to acknowledge two concepts:
The point estimate for a population mean is the sample mean. So to estimate the population mean tread wear index, we estimate it using the sample mean tread wear index.
Each individual data point in the sampling distribution that we just derived is a sample mean tread wear index by itself.
Now looking at the sampling distribution, we could approximate that 95% of the sample mean tread wear index falls into the red area below. This also means that if we randomly select a sample (of size n=18) and calculate the sample mean of tread wear index, there's a 0.95 probability that it will fall into the interval below. And since the sample mean tread wear index is an estimate of the population mean tread wear index, we can also say that we are 95% confident that the population mean tread wear index is in the interval below.
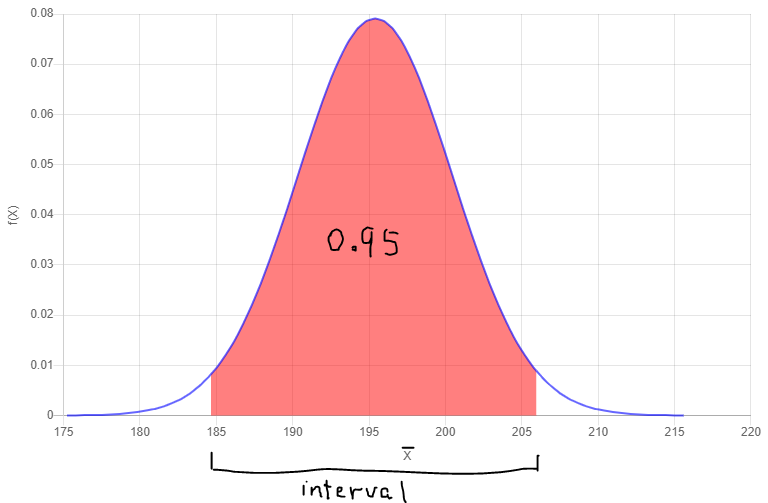
Note: Remember that the distribution above is the sampling distribution.
Standardization
To find the upper and lower limit of the interval, we must apply standardization to the sampling distribution. You may recall that standardization is the procedure to transform any normal distribution to a standard normal distribution (with μ=0 and σ=1). Note that the standard normal distribution is also called a Z distribution (which is why the resulting notation after standardization is a Z). The formula for standardization is:

Now if we were to standardize our sampling distribution, the standardization formula can be modified to:

Here is where I want you to be very very careful. Typically, if we follow the standardization equation above, the sampling distribution will be transformed into a Z distribution (which is why the notation is Z). But this is of course given that population standard deviation σ is known. If population standard deviation σ is unknown, we have to estimate it using sample standard deviation S. The standardization equation, thus, becomes this:

You'll notice two things have changed. First of all, σ is replaced by S. Secondly, the notation Z is replaced by t. This is because once you try to standardize your sampling distribution using S instead of σ, the sampling distribution will no longer be transformed into a Z-distribution, but a t-distribution.
The t-distribution is very similar to that of a Z distribution except it now depends on a degrees of freedom n-1. This basically means that the t-distribution will be slightly different depending on the sample size.

Ok, coming back to the question. We want to standardize our sampling distribution to find the confidence interval. Let's apply the standardization formula.

Notice here that the resulting notation is a t. This is because 21.4 is the sample standard deviation instead of the population standard deviation σ. The sampling distribution will be transformed into a t distribution with degrees of freedom n-1 (18-1=17). A t-distribution with df=17 will look like this:

We want to find the t-value below because they correspond to the upper and lower limit of the confidence interval.

Given the middle section accounting for 0.95, the upper and lower tail will each account for 0.025. We can then refer to the t-table to find the two t-values.


Now that we've found the t-value, I want to ask you a question. What exactly is the t-value?
Just like the Z value, the t-value actually represents the number of standard deviations you are away from the mean. So if the t-value 2.1098 corresponds to the upper limit of the confidence interval, the upper limit of the confidence interval would be 2.1098 standard deviations away from the mean

So to find the 95% confidence interval, we could apply the following formula:

We can safely say that "We are 95% confident that the population mean tread wear index for tires produced by this manufacturer under this brand name is between 184.6581 and 205.9419".
Again, I want to emphasize that the purpose of the confidence interval is to estimate the population mean. Given the sample mean and sample standard deviation, we think (with 95% confidence) that the true population mean is between 184.6581 and 205.9419. This is why in part 2, the consumer organization should not accuse the manufacturer of producing tires that do not meet the performance information "graded 200" provided on the sidewall of the tire. 200 falls within the 95% confidence interval.

Ok, part 3 is where most people get confused. Why an observed tread wear index of 210 for a particular tire is not unusual, even though it is outside the confidence interval developed in? Remember that the confidence interval is built upon the sampling distribution and the sampling distribution is made up of sample mean tread wear index. Each individual data point in the sampling distribution is a sample mean tread wear index.
Part 3, however, is asking for tread wear index, not sample mean tread wear index. This is why it has nothing to do with the sampling distribution. Instead, we just refer to the distribution of the sample (with a mean of 195.3 and a standard deviation of 21.4).
Note: Sampling distribution is NOT the same as the distribution of a sample. In case you still don't know, the sampling distribution is composed of the sample means from MANY samples (which is why each individual value in a sampling distribution is a sample mean), whereas the distribution of a sample literally refers to the distribution of ONE sample.
In this case, we can draw out the distribution of the ONE sample (with mean 195.3 and a standard deviation of 21.4). You can see 210 is quite close to the center, which means it won't be unusual. In fact, 210 would only be (210-1955.3)/21.4=0.69 standard deviations above the sample mean of 195.3


留言